From the noise to the useful signal
Scaling up data collection is a feat in itself, regardless of how you collect it. At Lute we collect the data around the clock in different environments and with different embodiments. Every piece of hardware has its own quirks, every teleoperator has a unique style of movement, and every data annotator has their own taste in labelling. When you add general videos of human actions collected during pre-training, you amass a large amount of data every day — but with high noise. In this blog post, we explore how we are building a set of quality metrics to keep improving data quality and the performance of final policies on challenging real-world problems tackled alongside our manufacturing partners.Tackling real-world problems - collaboration with iBombo
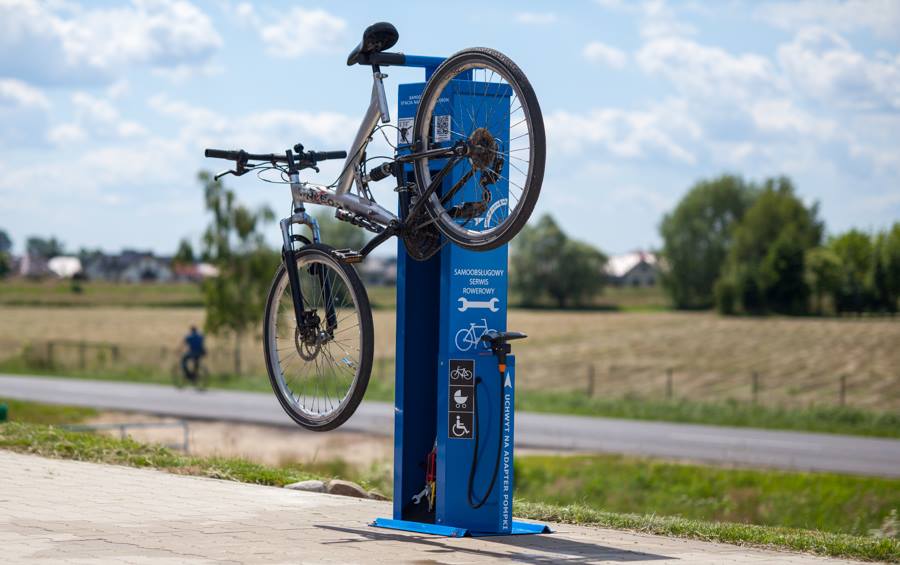
iBombo is a global leader in bike repair and solar charging station production with over 24000 stations deployed across 45 countries. Each station includes multiple tools for pumping or changing tires, replacing tubes, and adjusting gears. Their stations can survive in harsh weather conditions and are designed to be used by anyone, anywhere. Their production process requires a lot of manual work with dexterity and precision to produce custom parts. iBombo have partnered with Lute to automate their intensive and manual production process.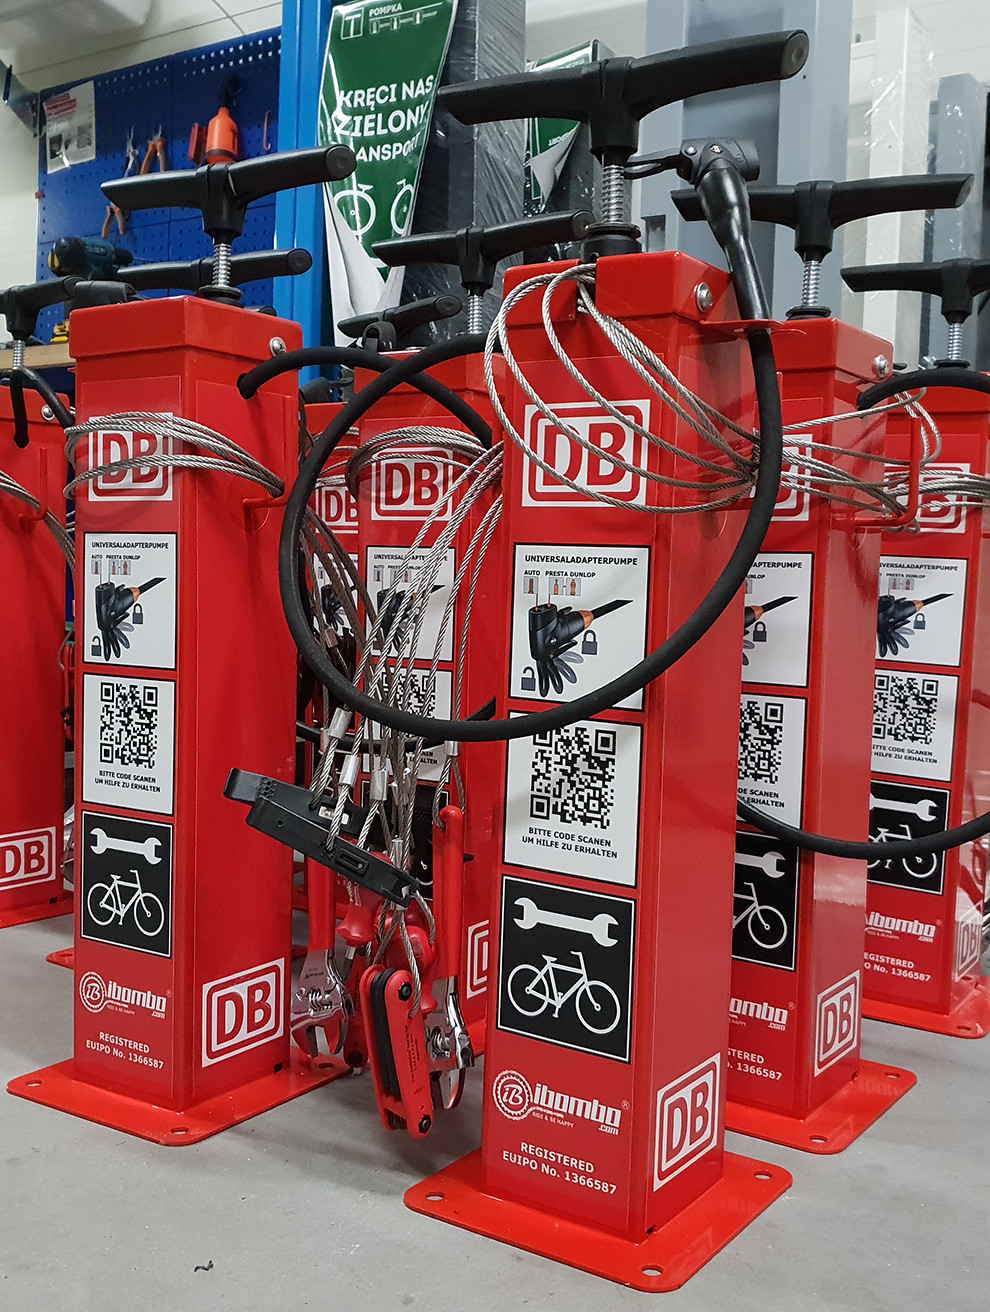
Simple yet challenging tasks
An example of such a subtask is threading a wire inside a fiber-reinforced polymer tube with sub-millimetre precision. We shared this challenge at our recent hackathon, giving participants actual components used on the factory floor, calibrated data in a well-established environment, ample compute. The eval setup allowed for reproduction of the behavior recorded during data collection. Multiple teams produced strong baselines, trying out a wide range of ideas — from data inspection and component arrangement to reward model approaches. However, the typical policy results in the following behavior:Finding bad apples
Collecting data at scale leads to all sorts of issues with the data quality. There are obvious ones like unfinished tasks or clearly not performed as intended:Discontinuity filter
One of our key signals detects sudden jumps in the action space between consecutive frames. Bad episodes contain isolated large spikes consistent with teleoperation errors or signal glitches, where a single frame's action vector shifts sharply before returning to normal. The magnitude of individual jumps is far more discriminating than their frequency — bad episodes spike hard, not often. This filter achieves a strong selectivity ratio, catching a meaningful share of bad episodes while leaving good demonstrations largely intact.| Threshold | Good rejected | Extra rejected | Ratio |
|---|---|---|---|
| 0.15 | 63.0% | 82.0% | 1.3x |
| 0.20 | 28.8% | 53.9% | 1.9x |
| 0.25 | 10.8% | 27.5% | 2.5x |
| 0.30 | 4.3% | 15.3% | 3.6x |
| 0.40 | 0.4% | 3.0% | >7x |
| 0.50 | 0.2% | 1.2% | >6x |
Variability filter
This filter measures how much each joint's action variance within an episode deviates from what is typical in clean data. Bad episodes show abnormally high variance concentrated in the wrist and gripper joints, suggesting erratic or inconsistent operator movements localised to fine manipulation rather than gross arm motion. Normalising against a clean baseline makes this filter robust across different recording sessions.| Scale factor | Good rejected | Extra rejected | Ratio |
|---|---|---|---|
| 1.2 | 59.7% | 78.7% | 1.3x |
| 1.5 | 13.8% | 31.5% | 2.3x |
| 1.8 | 3.2% | 12.9% | 4.0x |
| 2.0 | 1.3% | 5.1% | 4.0x |
| 2.5 | 0.2% | 0.0% | — |
There are several other heuristics that looked promising in theory but typically produced no useful signal in our data collection rig. A smoothness check on action jerk fails because isolated jumps average away across hundreds of frames — both good and bad episodes look equally smooth by that measure. An idle time check finds no meaningful pauses in either group; operators stay consistently active throughout. A gripper activity check is actively counterproductive, catching more good episodes than bad ones since deliberate grasping is a marker of quality, not a flaw. Episode length and workspace coverage show no correlation with quality for this task.
Reward model and temporal progress
We have previously explored how pretrained foundation models can work as data curators by detecting lack or corrupted progress in the value function. As we are training our large-scale robotics model LEM, we also see the first traces of generalisation in an early version reward estimates coming from the model. Since it is trained on over 20k hours of robotics data from different embodiments along with human data, it already allows us to quickly identify susceptible episodes which more deterministic rules cannot find since they lack the visual context. Here are some examples of the early version of LEM-RM variant in action catching wrong episodes:Emerging behavior
Once all of these guardrails are in place, the data filtering process becomes standardised and very reliable, allowing you to keep adding more data at scale and expanding to new and different tasks. That greatly improves the iteration cycle on research experiments as well as data modelling. It also reveals the beauty and meticulousness of human actions as they are translated into model behaviour. The following example shows how our technology can add the human touch to otherwise dull robotic movements.If you are working on improving quality of data or policies for your robots, we would love to hear from you! Reach out to us at contact@lute.one